
Chi-Square Test: A Comprehensive Guide
The Chi-Square test, often called the "goodness of fit" test, is a statistical method to evaluate the relationship between categorical variables. It is used to determine if there is a significant association between observed and expected data in a sample.
Understanding Hypothesis Testing
Hypothesis testing is a process used to assess and infer conclusions about a population based on sample data. It involves two main components:
Null Hypothesis (H0): Assumes no relationship or effect between variables.
Alternate Hypothesis (H1): Suggests a relationship or effect exists, based on sample data.
The Chi-Square test is one of many hypothesis tests, including z-tests, t-tests, and ANOVA, which are used to examine statistical differences.
What is a Chi-Square Test?
The Chi-Square test compares observed data with expected data to check whether the variables are independent. It answers the question: How well do the observed results fit an expected distribution under the assumption that the variables are independent?
When to Use the Chi-Square Test
This test is best suited for categorical data—data that can be divided into specific categories like gender or restaurant ratings. If working with continuous data (e.g., salary, time), the data must first be grouped into categories for the Chi-Square test to apply.
For example, imagine a restaurant app that rates restaurants as "good," "okay," or "not recommended." The test could determine if the ratings are independent of the restaurant size (small, medium, large).
Data Format for the Chi-Square Test
Data for this test should be in a tabular format, often represented in a 2x2 grid or larger, depending on the number of categories. Proper categorization and accurate counts are critical for valid results.
Performing a Chi-Square Test
1. Observed Values (O): The actual data collected.
2. Estimated Values (E): Calculated using the formula:
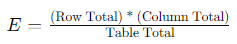
The difference between observed and expected values is used to calculate the Chi-Square statistic, which is then compared to a Chi-Square distribution to determine the p-value.
Conclusion
The Chi-Square test helps determine whether observed data fits a particular distribution, offering insight into the independence of variables. However, it does not provide details about the nature of the relationship if variables are dependent.
Comments (0)